
A world map on a screen can zoom all the way to your street. Folding Globes asks it to survive scissors and glue instead.
Daniel O'Donohue, the person behind MapScaping, turns cartographic and scientific datasets into printable PDFs that become small paper globes. Print, cut, fold the dashed lines, glue the tabs.
The classic version uses twenty triangles. Others resemble traditional globe gores, a football, a cube or an Airocean-style layout.
The gesture looks like a school craft project. The problem underneath is pure cartography: how do you move a curved surface onto paper without damaging it more than necessary?
The stubborn sphere
Every flat map distorts something. Distance, area, angles or shape eventually pay for the transformation.
Folding Globes does not remove that problem. It changes its local scale.
For the icosahedron, Earth is split into twenty triangular faces. Each face receives its own small projection centered on that part of the globe. Instead of asking one global projection to stretch the whole planet toward the edges of a rectangle, each map patch stays relatively close to its own projection center.
On the flat net, grid lines can curve gently inside a triangle. Bring the edges back together and the patches recover a three-dimensional form.
The site says distortion on an individual face stays too small to notice. The mechanism is useful without turning that sentence into a theorem: flattening any spherical patch still involves compromise. The practical difference is that the compromise is distributed over many small surfaces.
The fold is not decoration added to a finished map. It is part of the projection system.
Data on the table
The free catalog combines objects that rarely share the same craft drawer: Blue Marble, Earth at night, ocean temperature, vegetation, rainfall, biomes, population density, tectonic plates, major earthquakes, volcanoes and meteorite impacts, then the Moon, Mars, Jupiter, Io and Titan.
O'Donohue says the themes use open sources including NASA, USGS, NOAA, Natural Earth and the Smithsonian volcano inventory, with source credits attached to each theme.
Natural Earth is particularly friendly to this workflow. Its terms explicitly place its raster and vector map data in the public domain and allow modification, distribution and printing, including commercial uses.
That produces a satisfying chain: reusable scientific data passes through real map projections, becomes a print-ready file and ends up as an object somebody can hold by two badly glued faces.
The digital layer does not disappear. It prepares the point where the result becomes material.
Ten possible worlds
The builder offers ten geometries.
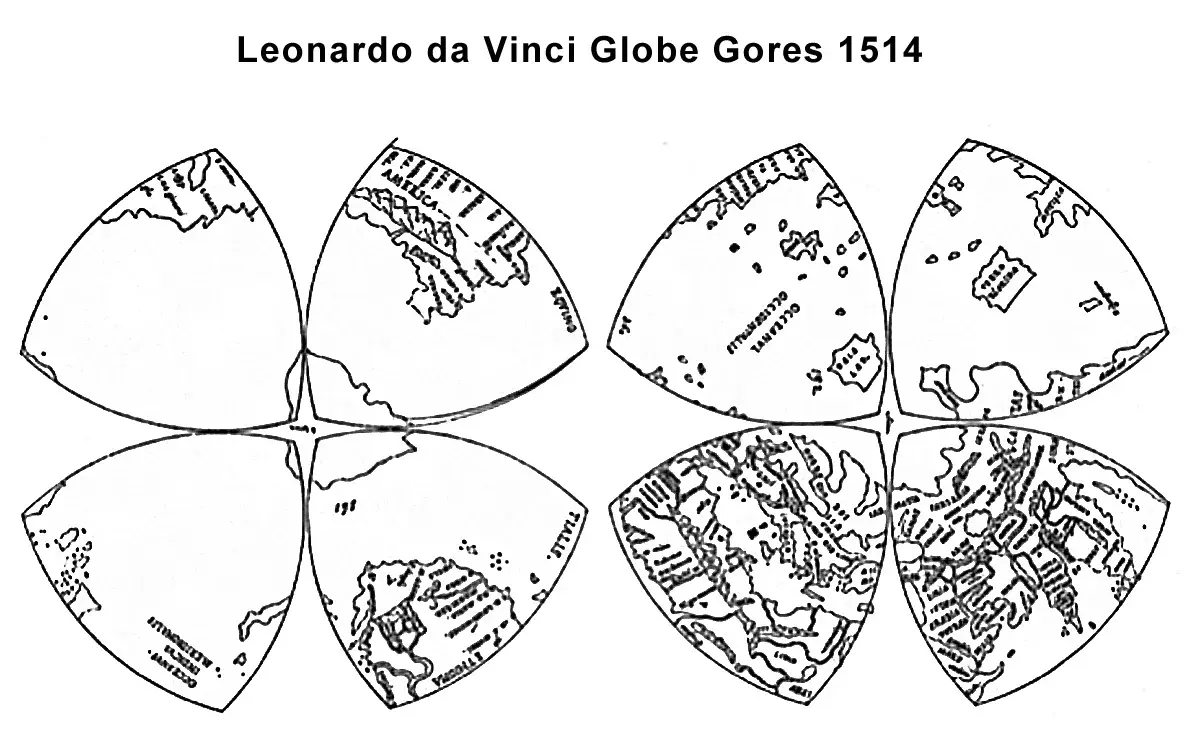
The icosahedron is the project's workhorse: twenty triangles, reasonably globe-like, with assembly estimated around twenty minutes. A cube gives up much of the roundness but becomes nearly trivial to build. The football shape uses 32 faces. Traditional gores use tapered strips that curl around the sphere.
There is also an Airocean layout described as being in the spirit of Buckminster Fuller, a Cahill-Keyes M, a dodecahedron, rhombic dodecahedron, octahedron and the minimal four-face tetrahedron.
Each makes a tradeoff visible that a normal mapping interface tends to hide: ease of assembly, continuity between continents, number of folds, resemblance to a sphere, readable panel size.
You can read several pages about map projections and still think of projection choice as an obscure dropdown in GIS software. A tetrahedron with Africa crossing an edge makes the compromise considerably harder to ignore.
The free doorway
The curated globes are free to download. The personalized builder, where users can choose a shape and add their own locations, is the commercial part of the project.
That model fits the object unusually well. You can understand the method by making a complete thing for free before paying for customization.
The site recommends printing at 100% on A4 or A3, using ordinary printer paper to start or 160–200 gsm stock for a crisper object. Solid lines are cuts, dashed lines are folds, lilac tabs get the glue.
There is nothing exotic about that protocol. That is part of the appeal.
Mapping tools have spent years making geographic data more interactive, precise and convenient to explore on screens. Folding Globes takes the opposite direction for the last meter: it uses that digital infrastructure to produce something slower, less practical, impossible to update and much easier to turn around in your hands.
The map loses its zoom. It gains edges.